
- PCS scores are calculated for each respondent (individual level analysis) based on the choices across the scenarios.
- Analysis is done either via traditional logit estimation or hierarchical Bayes (HB) estimation, with the latter being the most popular method due to its robustness.
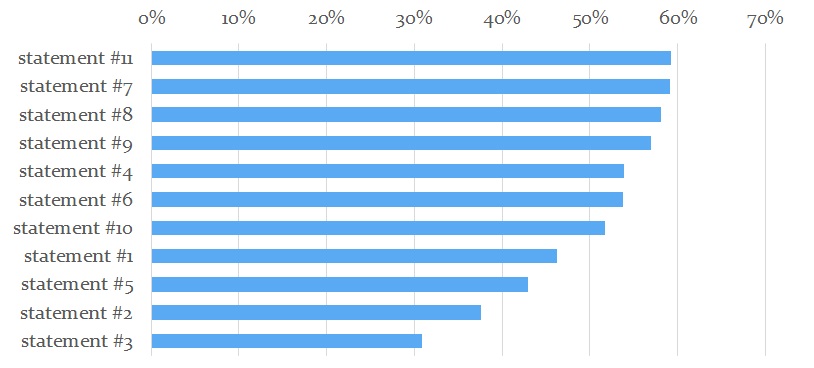
- PCS scores are then presented, usually on a bar chart, as percentages on a scale 0:100%.
The function PCS.csv2list available in R-sw Tradeoff prepares the structure for individual analysis of PCS data, which is done by either estimate.PCS.nonHB (logit estimation) or estimate.PCS.HB (HB estimation).