
Example of a unit circle map: this is a typical discriminant map where attributes / items are plotted on a circle and brands / products within the main area.
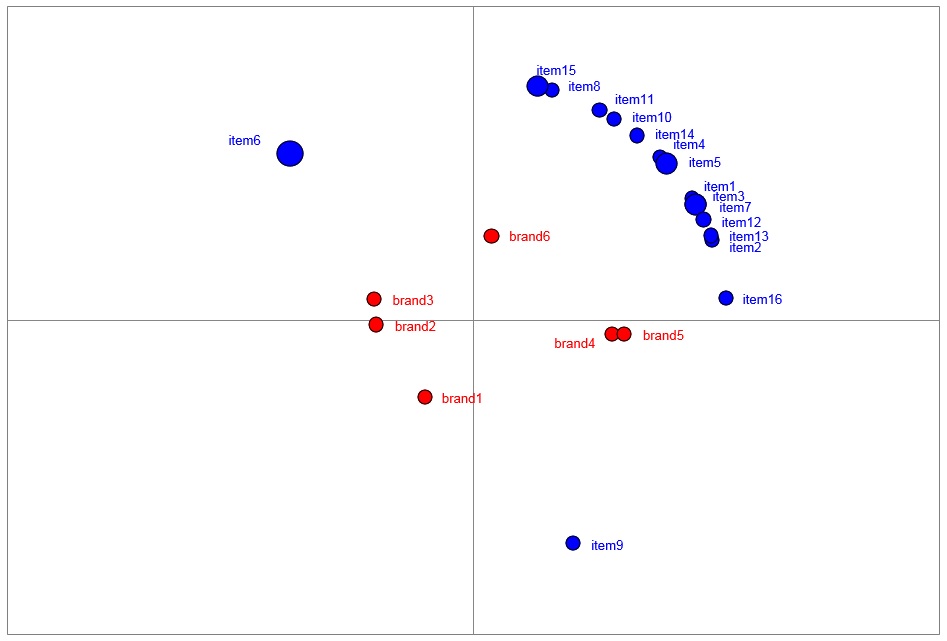
Example of a bubble map: this is a typical correspondence map where items (product features) and products are both plotted within the main area. In this map the size of the bubbles represents the relative importance of the items.

Comparison between Maps
The map below is the same as the previous one but with an approximate 35 degree clockwise rotation. Rotation is usually adopted to facilitate comparison of the current map with a map produced for a previous survey or for another geographical region.

Comparison can also be facilitated by using the scale function, as in the examples below where there the second map is the mirror image of the first one.

