
With ranking scales respondents are asked to rank the attributes based on importance (or preference). However, although ranking is a popular approach, there are some important limitations:
- inclusion and ranking of many attributes is challenging from a respondent’s perspective;
- scores are collected on an ordinal scale, while researchers prefer scores on an interval or a ratio scale, as more statistical analyses can be performed.
While it is possible to use alternative approaches (i.e., trade-off models), one might still prefer adopting ranking scales due to their widespread use. While limitation (1) can be partially addressed by using a partial-rank approach rather than a full-rank approach, limitation (2) can be fully addressed by analyzing the rank data through the Bradley-Terry model.
Bradley-Terry (BT) is a statistical technique used to convert importance or preference rankings of a list of attributes into importance or preference values for the same attributes on a powerful ratio scale.
What does this mean?
Ranks or ratings provided by respondents are converted into probabilities, allowing more precise conclusions to be made.
For instance, if attribute (2) is preferred over attribute (3) and attribute (3) is preferred over attribute (4), with traditional rank analysis we can say that attribute (2) is preferred over attributes (3) and (4), but we cannot properly quantify the difference in preference (only rank information can be provided).
However, with BT analysis, preference scores are presented on a ratio scale, therefore we might say that attribute (2) is, for example, 3 times as preferred as attribute (3) and 4 times as preferred as attribute (4).
- BT analysis is the ideal approach to obtain the most out of ranking scale;
- Ranking scales are included in the questionnaire in the usual way to estimate importance or preference of a list of items;
- BT analysis is run once the ranking data have been collected;
- BT analysis can also be run on rating scale;
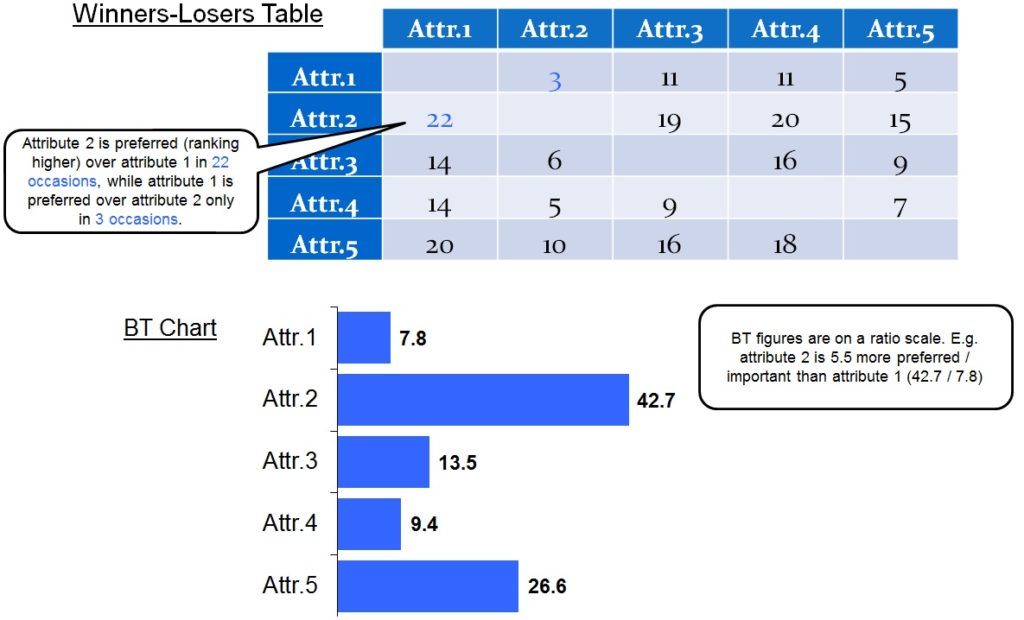
- BT analysis is based on the frequency with which one item “beats” (i.e., is ranked higher than) another item in the ranking exercise across a set of respondents;
- BT analysis is aggregate in nature, thus it is only possible to obtain BT estimates for the entire sample or a significant segment;
- BT scores are on a ratio scale, i.e., if attribute (1) has a score of 30 and attribute (2) a score of 15, this means that item (1) is twice as important or preferred as attribute (2).
The function compute.winnerloser.table available in R-sw Drivers provides the frequency tables showing the proportion of times each item “beat” another item. This table is then used as input by the function fit.BradleyTerry.model which run the actual BT model and provides the BT coefficients.
rankchoices.to.ranks is used to easily format the rank data as required by the functions above, while rating.to.rank is used to convert rating scores into ranks for a subsequent BT analysis.